Voice AI for Software Engineers: Rubber-Duck Debugging & Window Vision
Classic rubber-duck debugging works because explaining state transitions aloud exposes hidden assumptions. Pairing spoken explanation with a live AI that can also see your Xcode, VS Code, or architecture diagram window turns solo debugging into a senior staff review.
How spoken + visual debugging beats pasting 400 lines into chat
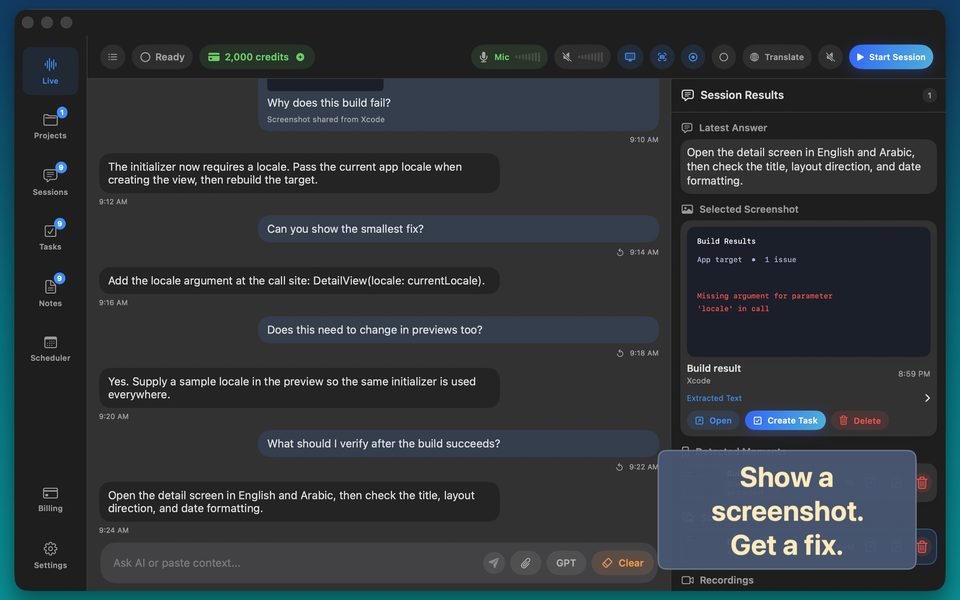
When you paste raw code into a chat box, LLMs eagerly rewrite working functions you never asked them to touch. When you attach a macOS window snapshot in GPT Realtime Assistant and explain the bug aloud—'Look at the retry loop here; why can two workers claim the same job?'—the model focuses on invariant violations rather than cosmetic refactors.
- Open GPT Realtime Assistant on Mac beside your IDE or Excalidraw diagram.
- Capture the active window as visual context.
- Explain the expected invariant vs observed failure aloud in 60 seconds.
- Ask the assistant to propose three falsifiable hypotheses before writing any code.
FAQ
What if my repository is under strict NDA and cannot leave my Mac?
Switch your Mac session to offline Whisper Large v3 Turbo + local Qwen 3 8B so zero audio or text leaves your machine.
Does side-by-side output preserve exact variable and function names?
Yes—the written answer pane keeps code identifiers readable while the voice summary stays brief.